Discovery Farms’ Nitrogen Use Efficiency Project provides farmers and agronomists opportunities to evaluate their N management to determine economic and environmental impacts of current practices. With five growing seasons of data collection and 300 fields in our database, we have established benchmarks for different nitrogen use efficiency (NUE) categories.
The benchmarks found in “Nitrogen Use Efficiency: Statewide Benchmarking for NUE in Corn Grain and Corn Silage” would be applicable to corn production in the Upper Midwest. An individual producer can calculate NUE for their field, compare their value to these benchmarks, and use decision trees to determine what shifts in management would be valuable for improvements in profitability and water quality.
Simple NUE assessments are a quick evaluation tool to identify if, and how, NUE can be improved. The first step is to evaluate partial factor productivity (PFP) on a given field. PFP is yield divided by N applied (pounds per acre or lbs./ac), or “How much did the field produce at a given N rate?”
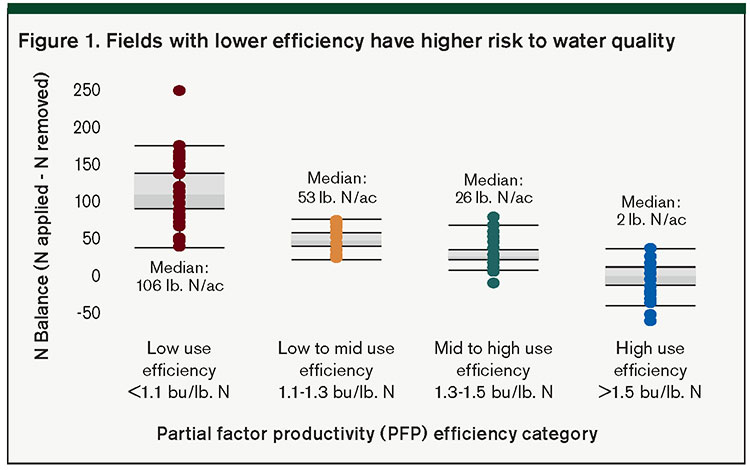
Fields with lower efficiencies not only provide an economic incentive to improve NUE but also have a need to reduce their risk to water quality.
N balance, or N applied minus N removed (lbs./ac), measures the amount of unused N in a system.
Some of this unused N will be lost to volatilization, denitrification, and ammonia loss, but the main pathway of N loss is through nitrate leaching. Therefore, N balance is a good indicator of potentially leachable N and is a valuable tool to assess water quality impacts of N applications.
Fields with PFP metrics in the low and low-mid use efficiency categories have higher N balances and pose a greater risk to water quality (Figure 1). These fields have the greatest potential — and need — to improve NUE.
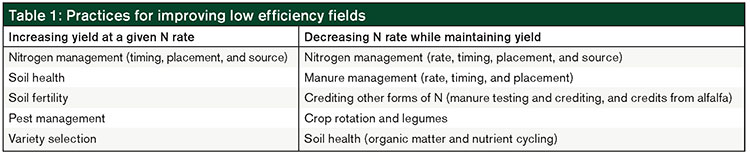
Improving efficiencies can be accomplished through a suite of practices (see table). In our database, fields with a PFP categorized as low and low-mid use efficiency have the greatest potential to improve for economic and water quality gains. Generally, improving NUE is accomplished by increasing yield at a given N rate or decreasing N rate while maintaining yield.
The value of test strips
Intensive NUE monitoring with in-field test strips is valuable to understand N cycling and potential to reduce N rates. In-field test strips add insight into nitrogen cycling dynamics and if or how producers can improve their NUE. Producers could include either a zero-N test strip or a reduced N rate test strip in their field.
A zero-N test strip serves as an indicator of soil health. Nitrogen supplied by the soil is estimated by measuring the nitrogen uptake of the crop in the zero-N test strip and subtracting the amount of nitrogen applied as starter fertilizer. In our dataset, this estimate of soil N supplied varied greatly. The median was 75 pounds N/ac and data ranged between 20 and 250 pounds N/ac.
We see a lot of variability due to inherent soil properties, field specific dynamics, management styles, and weather patterns, which highlights the challenge of implementing a universal N rate for a given region or state. Alternatively, by better understanding how individual fields behave without any N inputs, producers can fine-tune their N management to best serve their production system.
As farmers focus on conservation practices and transitioning to soil health systems, zero-N test strips are a useful tool to track changes in their nitrogen cycling. As the amount of soil N provided increases, there could be potential for producers to scale back on N inputs and maintain yield, which would result in economic gains and reductions in potentially leachable N.
Reduced N test strips evaluate the economic and water quality impacts of a full N rate compared to the reduced rate. We typically observe that at higher N rates, improvement in profits is marginal compared to additional risk in water quality. In Figure 2, which shows the increase in profit versus increase in N balance of the full N rate compared to the reduced N test strip, we observe a lot of variability. In some cases, additional fertilizer was very efficiently utilized so that the full N rate greatly raised profits with no or little increase to N balance. In other cases, additional fertilizer was inefficient, with little or no benefit to profits and a large increase in N balance.
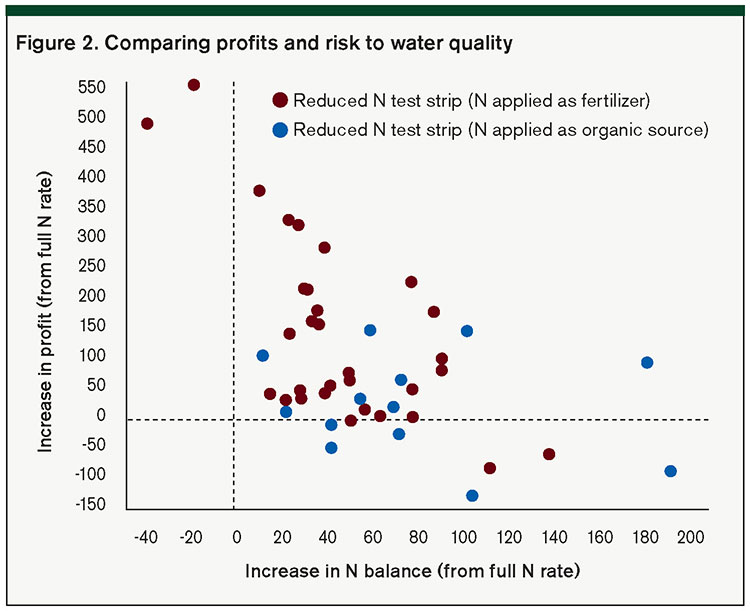
Some fields (indicated with the blue points) had reduced N test strips, where N inputs were exclusively an organic source (manure or legume credits). These fields tended to have a less efficient response to the additional fertilizer of the full N rate, meaning the full rate had a smaller rise in profit compared to the increase in N balance. If we can improve how we credit organic sources and reduce fertilizer inputs accordingly, there is potential to enhance NUE for fields that behave this way.
Room to grow
Participating in on-farm NUE research is a great way to improve N management in the face of rising fertilizer costs and scrutiny in reducing nitrate leaching. Discovery Farms’ guide on how to calculate NUE for your farm, “Nitrogen Use Efficiency: A guide to conducting your own assessment” (bit.ly/JNM-Nitrogen-Assess), is a great resource.
For more information regarding Discovery Farms or the NUE Project, visit www.uwdiscoveryfarms.org.This article appeared in the August 2020 issue of Journal of Nutrient Management on pages 6 and 7.
Not a subscriber? Click to get the print magazine.