The authors are with the University of Wisconsin-Madison where da Silva is a postdoctoral researcher and Cabrera is a professor and extension specialist.
Dairy farmers are under pressure due to the environmental impacts of greenhouse gasses (GHG), such as methane, nitrous oxide, and carbon dioxide emissions, which have been pointed out as contributors to global warming and climate changes. Furthermore, dairy farms can be sources of polluting elements such as phosphorus and nitrogen, potentially contaminating soils and groundwater when nutrients are not properly handled in those systems.
However, monitoring both GHG emissions and nutrient balance on dairy farms is a difficult and prohibitively expensive task. The most viable alternative for estimating GHG emissions and performing nutrient balance calculations for dairy farms has been the use of mathematical models.
Mathematical models constitute an important tool for the decision maker in the sense of offering diagnosis and guidance for designing strategies to mitigate GHG emissions or nutrient excretion. Fortunately, there are already several reliable model options that can be used with this purpose. The options out there vary in the types of approaches and levels of complexity, ranging from simple emissions factors to the use of process-based modeling, contemplating small details inherent to each step of the processes that occur inside a dairy farm.
Nevertheless, most of these models fail to reach end users and decision-makers because they require a significant amount of inputs to be populated and experience or training before they can be used. In this context, the DairyPrint Model takes its place as a high-level, simple, minimalistic, user-friendly, still powerful, and scientifically sound whole-farm decision support model to assess economic and environmental trade-offs of dairy farming for strategic nutrient management decisions.
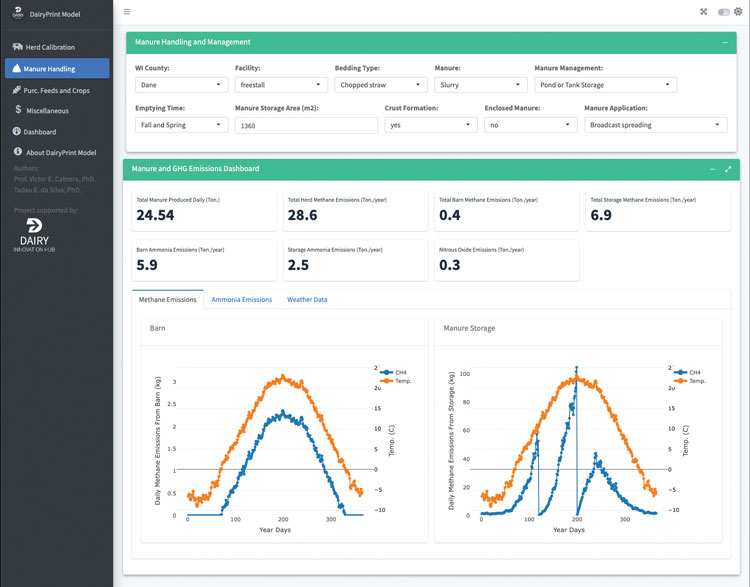
The DairyPrint Model is minimalistic regarding the inputs required, avoiding complex data-retrieving and focusing on the most relevant input variables. Moreover, it has a very user-friendly and intuitive graphical interface, allowing the user to set up their baseline scenario and easily interact with the tool to respond to “what-if” questions. For each simulated scenario, the user is able to explore the model interface, analyzing the main outcomes in detail through interactive dashboards and simple reports (Figure 1).
The model and its bases
The DairyPrint Model is being developed in a modular fashion, comprising the herd, manure handling, crop and feeds (homegrown and purchased), and economic modules. The herd module is the main driver and input provider for the other modules.
In the herd module, based on user inputs such as total number of cows, calving interval, replacement rate, and age at first calving, the model runs the simulations performing herd dynamics in monthly steps, estimating the herd demographics throughout the year. In addition to the herd demographics, milk yield curves and milk composition, body weight, dry matter intake, water intake, and feed efficiency are estimated.
These outcome variables, along with diet inputs, are used to estimate the total mass of excreted manure, urine, feces, nitrogen (N), phosphorus (P), and potassium (K), in addition to enteric methane and nitrous oxide emissions. The equations used in the model come from well-known literature sources (such as NRC 2001, IFSM, IPCC, and others) and were selected based on simplicity but keeping relevance.
From the herd module, there is a distribution of the produced outputs into other modules, in addition to the specific user inputs for each additional module. The economic module receives the dry matter intake (DMI) and milk yield from the herd module so that, in addition to inputs such as the cost of diets, total income, and income over feed cost (IOFC) are calculated.
The barn module receives all the manure produced and from it, along with information from weather data and type of facility, methane and ammonia emissions are estimated. The manure is transferred to the manure module, where it is handled and processed according to the practices adopted by the farm. The way manure is handled affects the amount and type of GHG emitted in this process.
Then, the processed material is distributed to the crop fields in the crop module. In the crop module, all GHG emissions are accounted for due to the application of manure, chemical fertilizers, and limestone. Additionally, emissions from feeds that are purchased on the farm are accounted for in terms of carbon dioxide equivalents (CO2e).
After accounting for all the processes that emit GHG, normalization for the calculation of CO2e is carried out using 100-year global warming potentials of 28 for biogenic methane and 264 for nitrous oxide. Based on the total sum of CO2e, and dividing the same by the total amount of milk produced in the year corrected for fat (4%) and protein (3.3%), an approximation of the carbon footprint of the farm is estimated. In addition to GHG emissions and carbon footprint, nutrient balances (N, P, and K) are also estimated.
Evaluating emissions
To demonstrate some scenarios, we first set up an average herd in the DairyPrint Model. For this, we considered a Wisconsin dairy farm located in Dane County with 150 Holstein cows housed in a freestall barn. Average weight at maturity of 1,500 pounds, with a calving interval of 15 months, culling rate of 35%, age at first calving of 24 months, average milk production per cow of 88 pounds per day, and cows milked three times a day. From this initial configuration of the herd, we designed three scenarios:
Scenario 1: Baseline — Chopped straw as the bedding type, slurry manure, crust formation, no biodigester, and manure lagoon emptied in the fall.
Scenario 2: Manure pond emptied twice a year — Chopped straw as the bedding type, crust formation, slurry manure, no biodigester, and manure lagoon emptied in fall and spring.
Scenario 3: Biodigester — chopped straw as bedding type, slurry manure, with biodigester (30% of efficiency), pond emptied in fall and spring.
As seen in Figure 2, we analyzed the scenarios from two different perspectives: in relation to the absolute total methane emission and with respect to the emission profile, represented by the proportions.
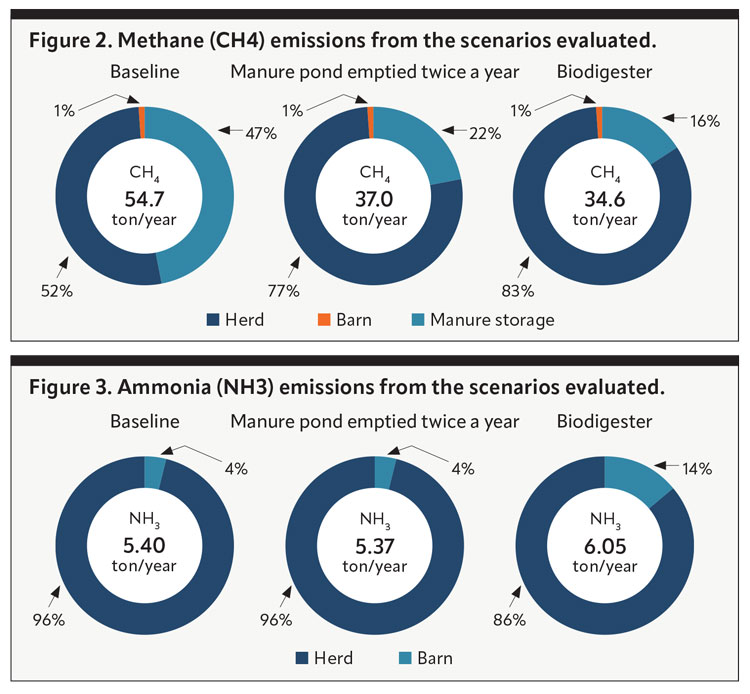
In terms of absolute methane emissions, we can see that both the manure lagoon emptied twice a year and biodigester scenarios were able to reduce emissions by 32% and 37%, respectively, compared to the baseline. The twice-yearly emptying of the manure storage significantly reduces the amount of volatile solids available in the lagoon, making emissions low because less substrate is available for fermentation with less volatile solids, and therefore, less methane is produced.
In the case of the biodigester, the fermentation process of the volatile solids in a controlled environment allows the gas produced to be captured and used on the farm, such as generating electricity or being burned to heat water on the farm. When burned, methane is converted to carbon dioxide, then returning to the natural carbon cycle, not being accounted for in GHG emissions.
The reduction associated with the use of sand as a bedding type is due to the significant reduction in the amount of volatile solids reaching the manure lagoon. These solids have the potential to be biodegraded and produce methane gas as a result.
Although there is currently a lot of research focused on reducing enteric methane emissions via diets, nutritional additives, genetics, and so forth, we think there are low-hanging opportunities regarding potential GHG emission mitigation by better managing manure and using it as an energy source for the farm. As shown in Figure 3, in terms of absolute ammonia emissions, we can see that a manure lagoon emptied twice a year slightly reduced ammonia emissions.
On the other hand, the biodigester scenario elevated the total ammonia emissions and also the contribution of manure storage emissions compared to the baseline. The rise in ammonia emissions with the use of biodigesters is explained by the fact that part of the N is converted from organic to inorganic form during the fermentation process. Therefore, there is more N available for volatilization in the manure storage, increasing losses to the atmosphere.
Our main objective of this example was to demonstrate the ability of the DairyPrint Model to provide rapid diagnosis and answer “what-if” questions to help in the decision-making process. The DairyPrint Model is available at https://bit.ly/DairyPrintModel.