The author is a retired professor of dairy science from South Dakota State University. He is now a consultant with Dellait Dairy Nutrition and Management.

In today’s ever-changing agricultural landscape, the focus on sustainable practices has never been more crucial. Alongside productivity and profitability, environmental sustainability has become a key priority in livestock production.
Among the various sectors, the dairy industry holds particular significance due to its potential impact on greenhouse gas (GHG) emissions. The emissions of carbon dioxide (CO2), methane (CH4), and nitrous oxide (N2O) from dairy production contribute to climate change, emphasizing the need for effective mitigation strategies. One valuable approach to understanding and reducing these emissions is through life cycle assessments (LCAs), which provide valuable insights into various stages of production and identify areas for improvement.
Mitigation at the farm level
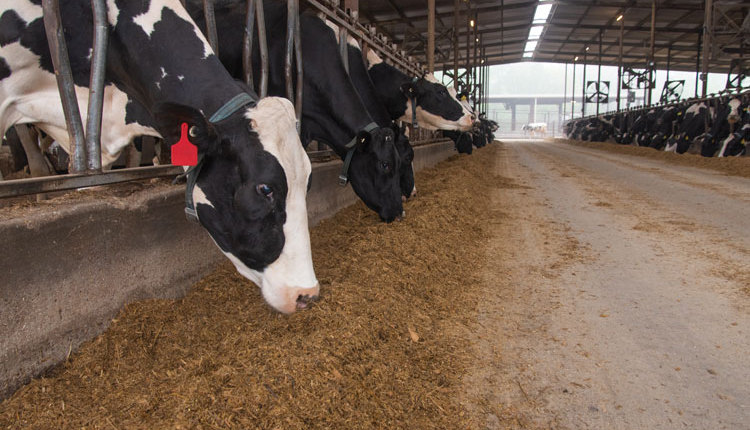
A recent study conducted in South Dakota estimated the carbon footprint to produce 1 kilogram (kg) of fat and protein-corrected milk (FPCM) to be 1.23 kg CO2 equivalents. The major contributors were enteric methane (46%) and manure management (32.7%). Feed production and farm management made up 14.1% and 7.2%, respectively. These findings highlight the importance of examining the environmental impact of dairy production and identifying opportunities for emission reduction.
To assess the environmental impact of individual dairy cows, we can calculate their CO2 equivalent emissions based on the amount of FPCM they produce. Let’s consider two farms, A and B, and estimate their emissions per cow. Assuming cows at Farm A produce 80 pounds of milk per cow on average with 3.5% fat and 3.2% protein, while cows at Farm B produce 75 pounds of milk with 4.2% fat and 3.4% protein, we can determine their FPCM values.
For Farm A:
FPCM = (80 x (0.4 x 3.5 + 0.21 x 3.2)) = 80 x (1.4 + 0.672) = 80 x 2.072 = 165.76 pounds
For Farm B:
FPCM = (75 x (0.4 x 4.2 + 0.21 x 3.4)) = 75 x (1.68 + 0.714) = 75 x 2.394 = 179.55 pounds
Now, let’s calculate the CO2 equivalent emissions per cow for each farm. CO2 equivalent emissions per cow = FPCM per cow x emission rate
For Farm A:
CO2 equivalent emissions per cow = 165.76 pounds x (1.23 kg CO2 equivalents/2.2046 pounds) ≈ 91.84 kg CO2 equivalents
For Farm B:
CO2 equivalent emissions per cow = 179.55 pounds x (1.23 kg CO2 equivalents/2.2046 pounds) ≈ 99.93 kg CO2 equivalents
Each cow on Farm A produces 80 pounds of milk with 3.5% fat and 3.2% protein, resulting in an FPCM value of approximately 165.76 pounds. Each cow on Farm B produces 75 pounds of milk with 4.2% fat and 3.4% protein, resulting in an FPCM value of approximately 179.55 pounds.
Cows on Farm B exhibit a higher FPCM value and estimated CO2 emissions (approximately 99.93 kg CO2 equivalents) compared to cows on Farm A (approximately 91.84 kg CO2 equivalents). These findings suggest that cows on Farm B have a greater environmental impact due to their higher milk production and associated emissions.
The intention here is not to suggest reducing milk production or compromising its nutritional value. Rather, these insights emphasize the importance of informed decisions that harmonize environmental concerns with nutritional needs. The dairy industry can drive progress by adopting resource-efficient practices, optimizing feed use, refining waste management, and leveraging technology to lower emissions without sacrificing milk production.
The importance of intensity
To further assess environmental impact, it is essential to compare cows or farms based on the CO2 equivalents produced per kilogram of milk, also known as emission intensity. The emission intensity represents the conversion factor used to estimate the CO2 equivalent emissions associated with milk production by considering factors such as enteric methane, manure management, feed production, and farm management.
The emission rate of 1.23 kg CO2 equivalents per 1 kg FPCM, mentioned in this article, provides a measure of the average emission intensity for the dairy industry in South Dakota. By applying the emission rate to the FPCM values of individual cows, we can estimate the CO2 equivalent emissions associated with their milk production, enabling a comparative assessment of the environmental impact between different cows or farms.
Let’s compare Farms A and B in terms of CO2 equivalent emissions per pound of milk produced by dividing the emissions by the milk production:
For Farm A:
CO2 emissions per pound of milk = 91.84 kg CO2 equivalents/(80 pounds/2.2046 pounds per kg) ≈ 1.148 kg CO2 equivalents per pound of milk
For Farm B:
CO2 emissions per pound of milk = 99.93 kg CO2 equivalents/(75 pounds/2.2046 pounds per kg) ≈ 1.331 kg CO2 equivalents per pound of milk
While Farm B does exhibit a higher emission intensity compared to Farm A, it’s essential to look at the bigger picture. Farm B’s higher milk production reflects optimized resource efficiency, potentially resulting in fewer emissions per unit of milk. This suggests Farm B is effectively utilizing resources to maximize milk output. This nuanced perspective underscores the multifaceted nature of emission analysis, emphasizing the importance of evaluating productivity, efficiency, and sustainability practices.
Greenhouse gas emissions, and especially the carbon footprint, should be carefully considered in dairy production. Life cycle assessments (LCAs) offer valuable insights into the overall environmental impact, encompassing various stages from feed production to farm management. By incorporating LCAs and addressing environmental concerns, the dairy industry can strive toward more sustainable practices and mitigate its ecological footprint.
This article appeared in the November 2023 issue of Journal of Nutrient Management on pages 8-9. Not a subscriber? Click to get the print magazine.